
For myself, I find it more useful to send information the other way. The first thing I did was to install temperature sensors to monitor the solar heating system I designed for my workshop:

I also installed temperature sensors in the heat recovery ventilation system I installed in my workshop that clearly demonstrate how well it performs:

These gauges update in real time on my web page documenting its performance.
I deployed another ioBridge that monitors the solar domestic water heating system I installed for my home:

I was able to use this monitoring system to diagnose a failed piece of equipment last June. Here is my blog page about that little adventure.
The monitoring equipment is mounted on the wall near each device, and any time anyone is looking at a webpage with this information on it the device lights up a number from 1 through 4 indicating which of the four sensors are being read and providing live data to that webpage.
 It is quite encouraging for me to walk into my utility room and see numbers flashing on these units indicating live viewer(s). By the way, the folks at ioBridge consider to me to be a power user - deploying technology like this is not for the faint of heart or the technologically naïve.
But wait there's more! When I purchased my Chevy volt electric vehicle, I became very interested in monitoring how much power it uses to charge the battery. And I also wanted to know how much energy it needed to use to keep the battery warm in the dead of winter. It uses power from the charging station to heat the battery to keep it from being damaged by freezing. So yet another web page with charts:
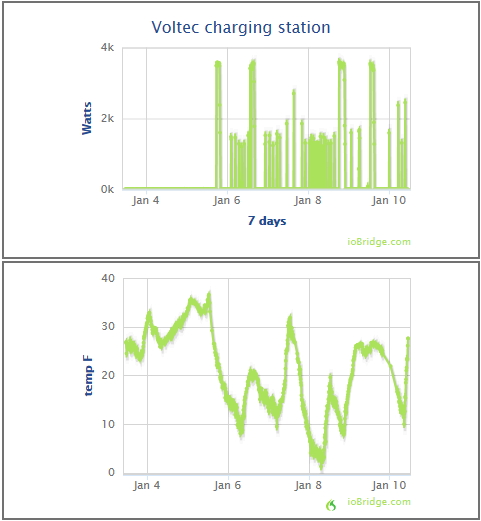 The chart above correlates temperature dips and energy consumption from the charging station. Tall spikes are when I charge the vehicle, short (lower energy) spikes are for battery thermal management.
And yet more… after the Fukushima nuclear meltdown, I geeked out and built a Geiger counter kit. And it occurred to me I could interface that to the web:
 The surprise result from this experiment was that I could detect solar events such as Coronal Mass Ejections (high-energy radiation from sunspots) as shown in the chart above. My webpage compares charts from my Geiger counter with actual current solar radiation information for comparison.
Oh yes, there's more! I also have a weather station that feeds live data to the Weather Underground, there are several ways to access my data from the web including the Rapid Fire page below:


And yet more… after the Fukushima nuclear meltdown, I geeked out and built a Geiger counter kit. And it occurred to me I could interface that to the web:
Oh yes, there's more! I also have a weather station that feeds live data to the Weather Underground, there are several ways to access my data from the web including the Rapid Fire page below:
My Weather Underground personal weather station page shows current and historical data in considerable detail along with an up-to-date WebCam image of my home or workshop. Years ago, I used historical information from my weather station to evaluate my site for a small wind turbine. (More about my recently upgraded weather station in this recent blog page).
The solar power system that I installed starting in 2009 came with its own web portal that monitors the energy output of every panel individually - this information is available to me privately. On my webpage I show the public information showing energy generated on a daily basis. I also show historical energy and cost information based on accurate records I have kept of site energy production and electrical bills.
One of the first live-to-web items I added to my webpage was images from two WebCams showing my home updated every minute:
 | |
| Live image of my home |
 |
| live image of my workshop |

I monitor almost all of these pages on a daily basis and it gives me warm fuzzies to know that all of my systems are operating well and my solar systems are saving energy and money.
What would (or do you) use for a high speed data logger with a decent PC interface for experimentation? Ideally something that is reasonably low cost, records multiple times a second and easy to use. Application is high current DC at 72v similar to a golf cart setup.
ReplyDeleterj - I have use HOBO dataloggers for years for this application.
ReplyDeleteI have this one: http://www.onsetcomp.com/products/data-loggers/ux120-006m
Their engineers are very helpful on the phone when you need to specify a sensor or configure the logger.